Ontologies
As cultural heritage is continually shaped and transformed in the online world, museums must keep up with two main objectives. First, cross-searching of distributed resources is needed to achieve interoperability of the available cultural content. And second, the integration of data infrastructures and
schemas that can be easily used and understood both by museum staff and researchers. To accomplish these two objectives, a proper metadata structure for curating cultural content is mandatory, if a museum seeks to develop a strategic plan for increasing digital access to its collections.
To address these, MELTOPENLAB considers the following metadata schemas, covering four basic and complementary aspects:
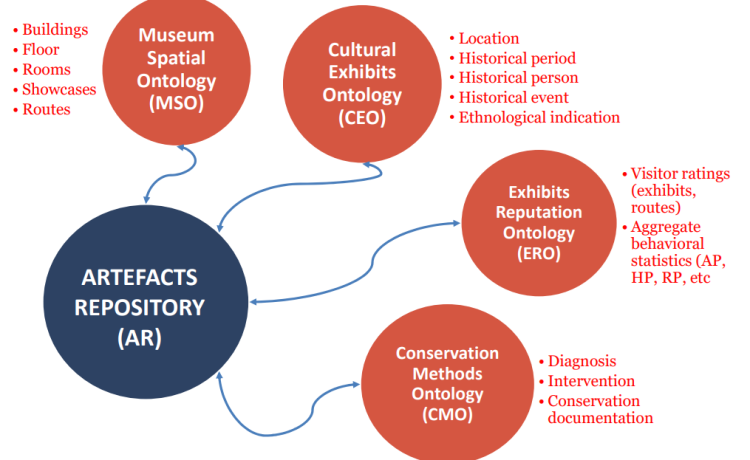
- Descriptive Metadata Schemas: The Cultural Exhibits Ontology (CEO) combines metadata standards for capturing the artefacts/exhibits descriptive information (metadata schemes used: CIDOC-CRM, VRA, DC).
- Reputation Metadata Schemas: The Exhibits Reputation Ontology (ERO) supports the exhibits’ ratings as they are submitted by the visitors and metrics/indicators evaluating their popularity based on visitor behaviour (MELTOPENLAB custom ontology built).
- Preservation Metadata Schemas: The Conservation Methods Ontology (CMO) aims to provide a standardised way to document methods used for the artefacts/exhibits’ conservation methods (metadata schemes used: CIDOC-CRM, DC).
- Indoor Navigation Metadata Schemas: The Museum Spatial Ontology (MSO) represents building and room/floor plans with exhibit allocation and installed sensor coverage areas (cells) (ontology used: iLOC, further addressed in the sequel).
- Innovation / Cost-effective visitor tracking technologies integration
The project focused on developing an advanced information system that captures visitor movement in near real-time and analyses collected data. The system is designed cost effectively, i.e., employing both energy-efficient and widely available technologies.
Proximity-Based Detection (PBD) was the most appropriate tracking method, as the relative position between the visitors and exhibits (distance) and the movements around them was sufficient for estimation in an indoor space, rather than the precise coordinates.
The use of wearable e-tickets (as essential visitor tracking equipment) that are popular among museum managers, for security reasons and statistics collection, were adopted in MELTOPENLAB, to address the fact that smartphones cannot effectively and efficiently cover the needs regarding the anonymous tracking of visitors, due to Android and iOS MAC ID randomisation, mobile devices’ power saving schemes and user unpredictable use of smartphone.
Signal strength (RSSI) was adopted as the prevailing technique, considering dense visitor traffic in MNEP’s complex closed spaces, which make it difficult to maintain line of sight (LOSs) between moving user devices and fixed sensors, as well as cost, market availability, and scalability / exhibition re-organisation requirements.
Bluetooth Low-Energy (BLE) and RFID technologies were also selected, considering power consumption,
cost efficiency, market availabil-ity/compatibility, and scalability as critical requirements.
Kalman filters, widely used in systems with Gaussian and non-Gaussian noise propagation, were adopted
in MELTOPENLAB as an attempt to provide an adequate level of signal (RSSI) equalisation regardless
of noise. Results achieved, indicated a smoothing of the RSSI fluctuations by a factor of 1/10 after
one-dimensional linear KF application.
Graphs of allowed transitions between cells in MNEP spaces (static one-hop tables), were also applied,
as an additional layer of spatial / topology filtering, built in a deterministic manner, for each museum
space to detect and correct possible RSSI-based tracking errors and failures.
Finally, a Machine Learning Prototype predicting the current cell was studied, integrating in its training both pilot signal measurements and hints provided by the above static graphs (e.g., spatially nearest cells), or other knowledge related to movement (e.g., next cell when following a certain route). Training and testing data sets were recorded during project pilots, following a certain mixed movement pattern, involving a max of four users–visitors per cell. Results indicated a maximum improvement exceeding 20% over the raw maximum RSSI cell prediction (relevant to the specific large museum hall tested, and variations of algorithms used, including K-NN, C4.5, RF, SVM, BayesNet, and Perceptron).